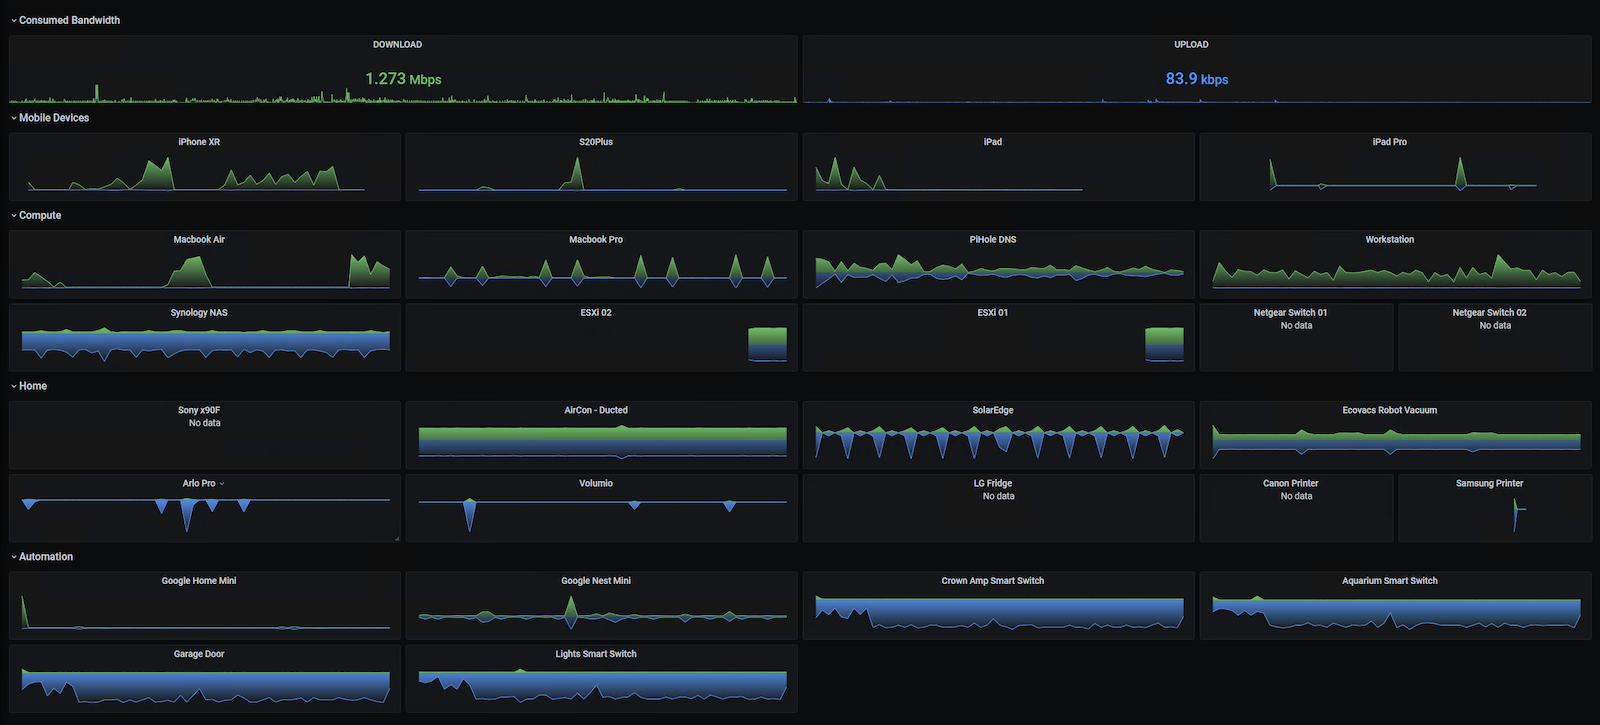
I’ve always been interested in knowing which device consumes internet bandwidth on my network. Given I’m on a 50Mbps line, bandwidth is a premium(Thank you NBN!) So how did I go about monitoring internet bandwidth consumption across all my devices? A NOC style interface will be cool! (click on the image above!)
I got this done with the help of Grafana, influxdb, ntopng and Opnsense!
TLDR: Opnsense -> ntopng -> Influxdb -> Grafana
- Opnsense is the gateway router.
- ntopng probes and montiors network traffic on Opnsense.
- ntopng can be configured to write out data in a time series format to Influxdb.
- Grafana plots cool graphs for the time-series data stored in Influxdb.
Opnsense

If you just have a barebones router at your house, I would strongly recommend that you start looking at Opnsense or pfsense as a firewall and router!
I run Opnsense in a VM on a Lenovo M900 tiny PC running ESXi. The M900 tiny PC is configured as a one-arm router using VLANs. The primary reason I chose a M900 was due to its low power consumption. Approx. 38W!
Installation is covered in the official opnsense documentation here
After you have setup Opnsense, make sure all of your devices either have a static ip address or static leases.
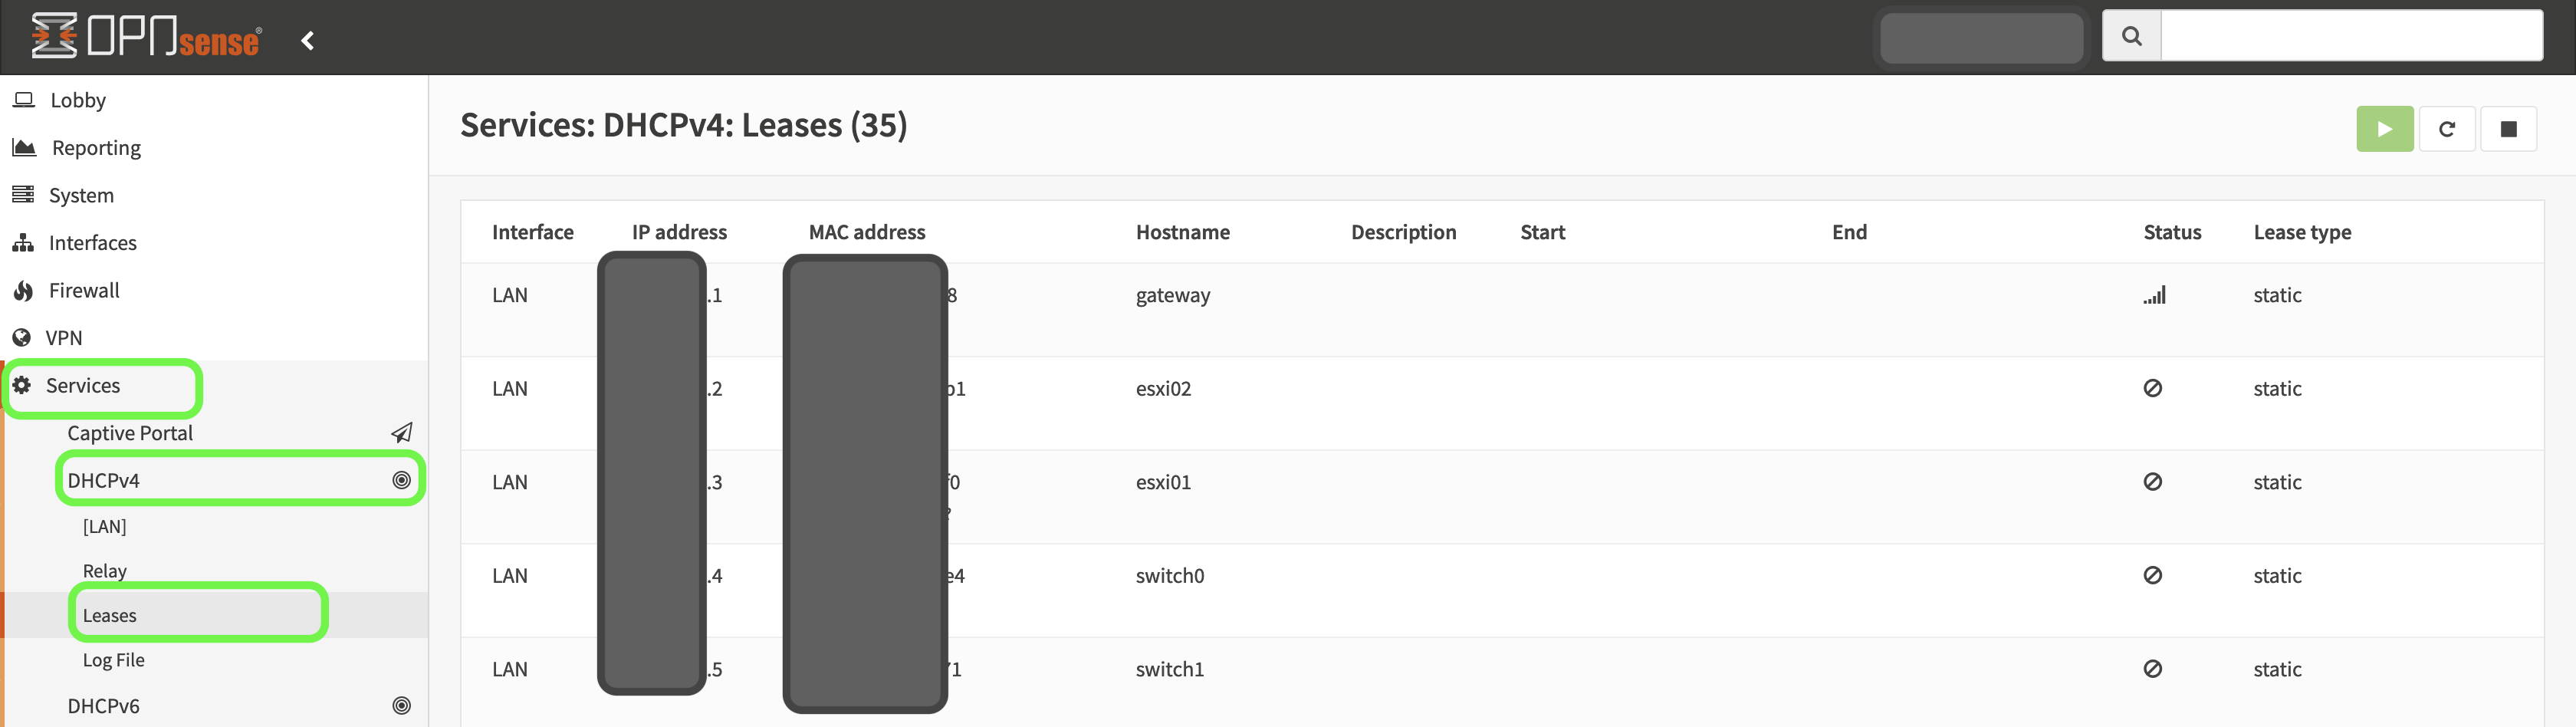
The static ip addresses will help with the queries you will use when creating graphs in Grafana.
ntopng on Opnsense
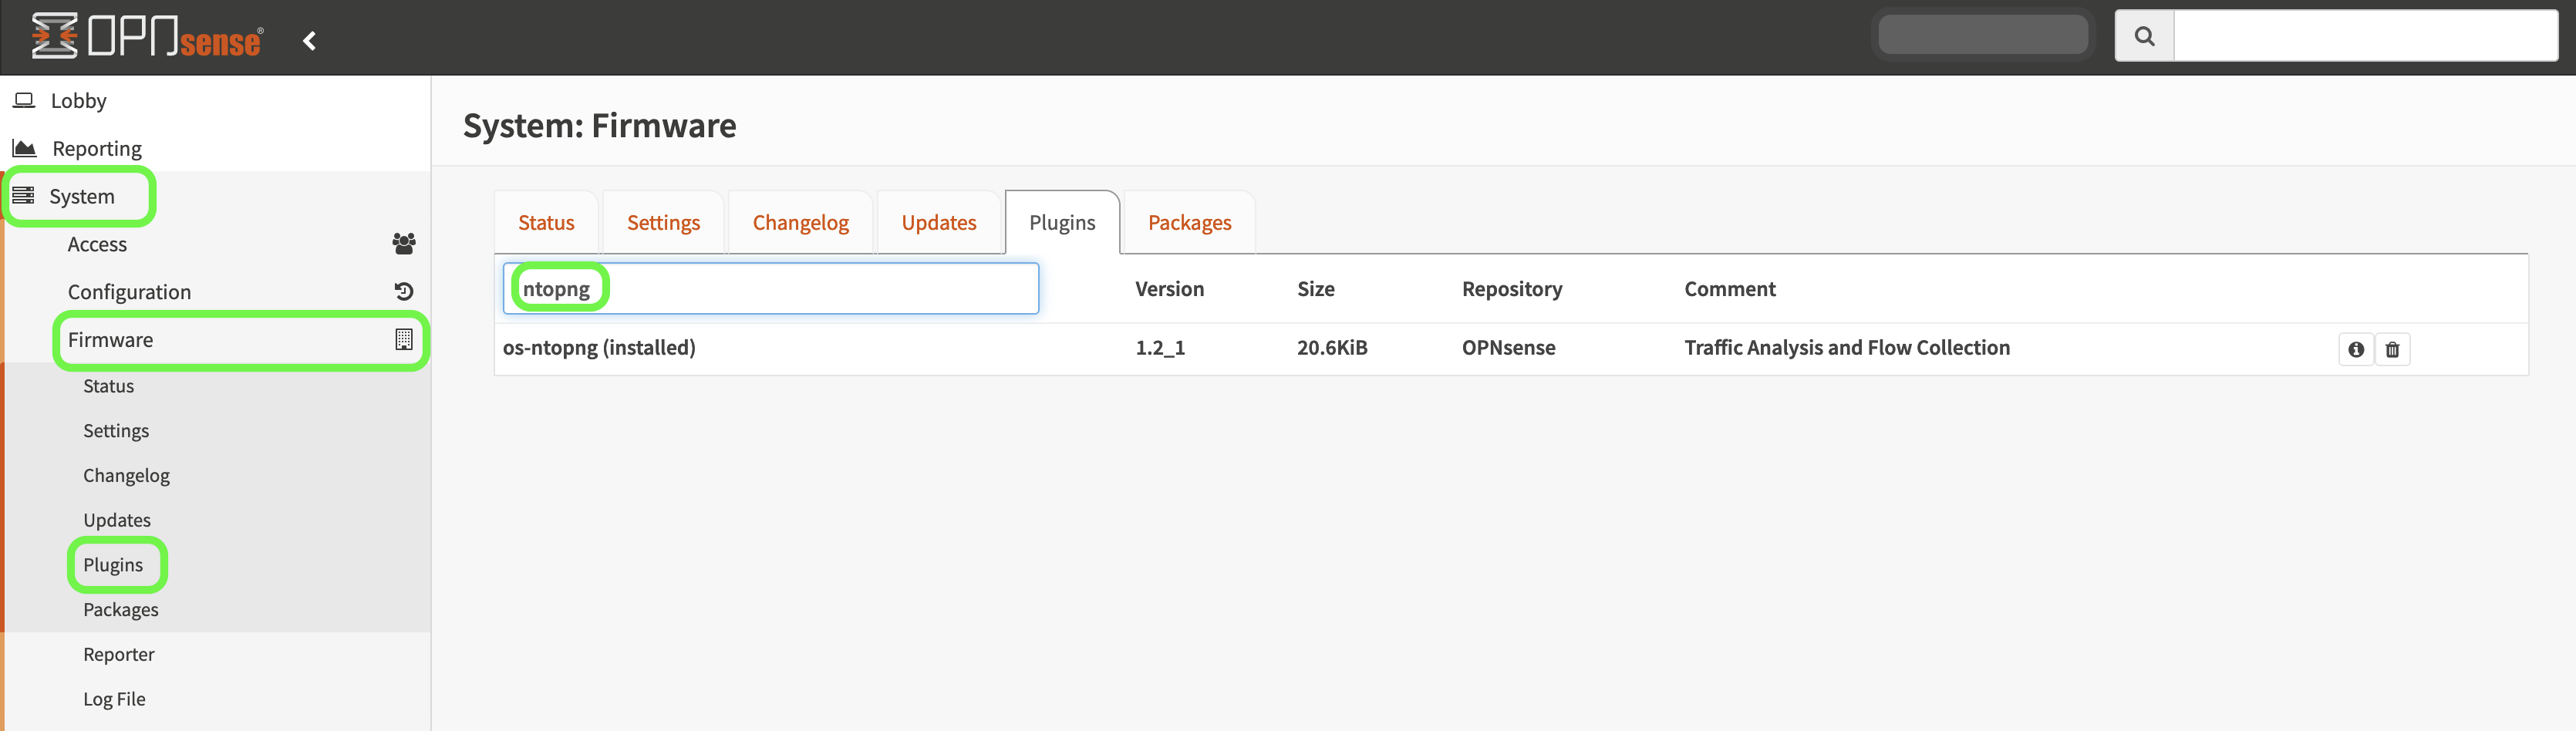
Install the ntopng and redis plugin on Opnsense.
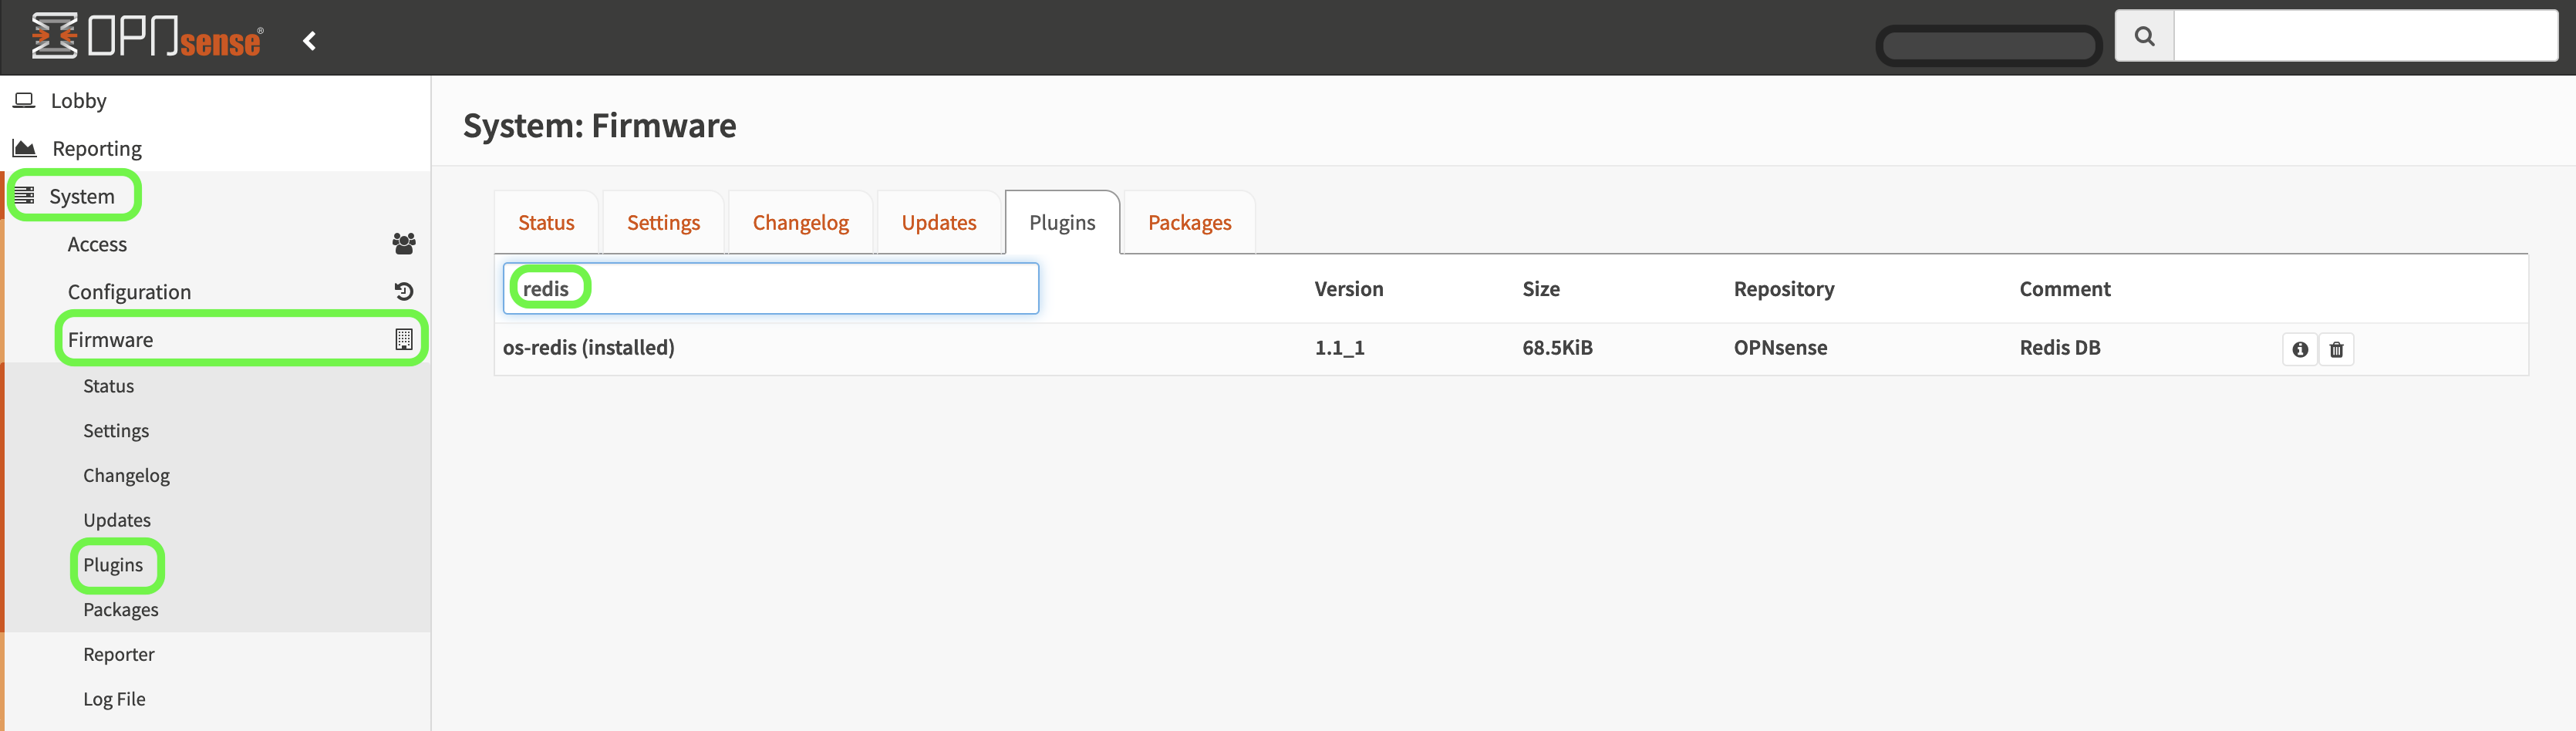
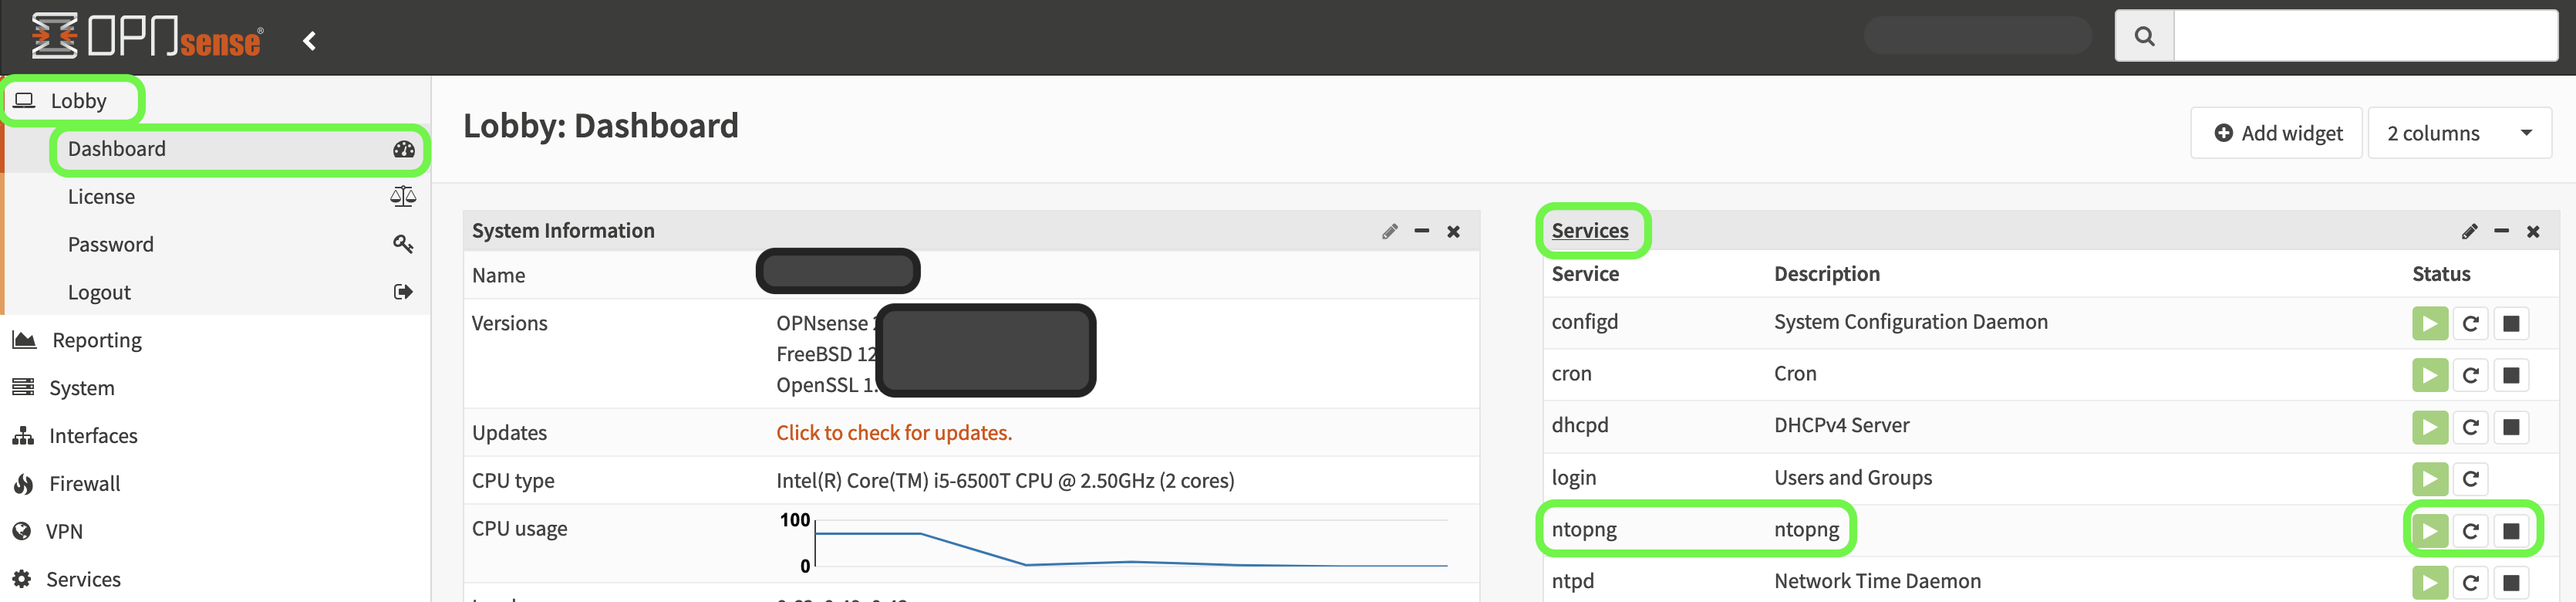
Ensure the service is running
Influxdb
 I used a debian VM for Influxdb and Grafana.
As of writing this post ntopng only supports influxdb 1.8x
I used a debian VM for Influxdb and Grafana.
As of writing this post ntopng only supports influxdb 1.8x
Official installation instructions can be found here
Install Influxdb on debian
wget -qO- https://repos.influxdata.com/influxdb.key | gpg --dearmor > /etc/apt/trusted.gpg.d/influxdb.gpg
export DISTRIB_ID=$(lsb_release -si); export DISTRIB_CODENAME=$(lsb_release -sc)
echo "deb [signed-by=/etc/apt/trusted.gpg.d/influxdb.gpg] https://repos.influxdata.com/${DISTRIB_ID,,} ${DISTRIB_CODENAME} stable" > /etc/apt/sources.list.d/influxdb.list

sudo apt-get update && sudo apt-get install influxdb
sudo service influxdb start
After installation, you can use the command influxto create databases, etc.
root@grafana:~# influx
Connected to http://localhost:8086 version 1.8.9
InfluxDB shell version: 1.8.9
> show databases
name: databases
name
----
telegraf
_internal
ntopng
> use ntopng
Using database ntopng
> show measurements
name: measurements
name
----
country:score
country:traffic
host:active_flows
host:alerted_flows
host:cli_active_flows_anomalies
host:cli_active_flows_behaviour
host:cli_score_anomalies
host:cli_score_behaviour
host:contacts
host:contacts_behaviour
host:dns_qry_rcvd_rsp_sent
host:dns_qry_sent_rsp_rcvd
host:echo_packets
host:echo_reply_packets
host:engaged_alerts
host:host_unreachable_flows
host:l4protos
host:num_blacklisted_flows
host:score
host:srv_active_flows_anomalies
host:srv_active_flows_behaviour
host:srv_score_anomalies
host:srv_score_behaviour
host:tcp_packets
host:tcp_rx_stats
host:tcp_tx_stats
host:total_alerts
host:total_flows
host:traffic
Influxdb will listen on port 8086
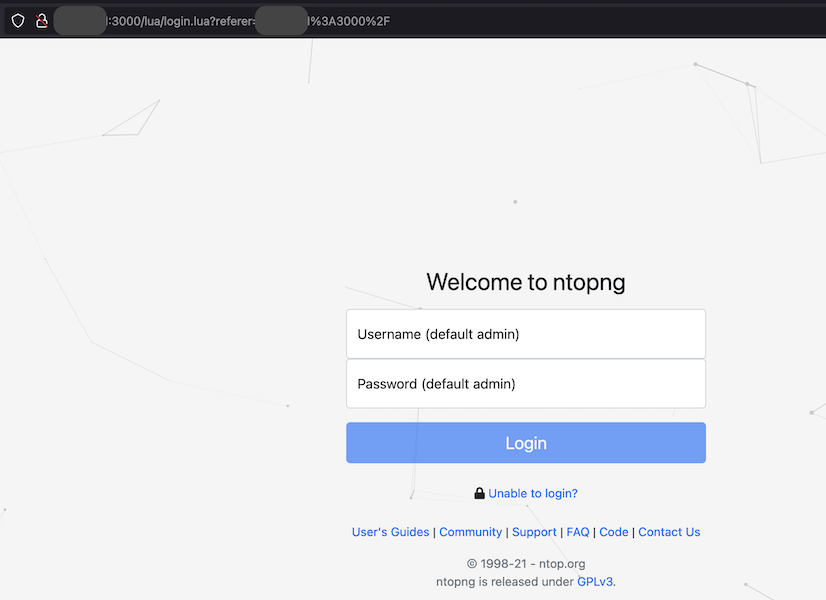
ntopng

ntopng listens on port 3000. Login to ntopng using your routers IP:3000
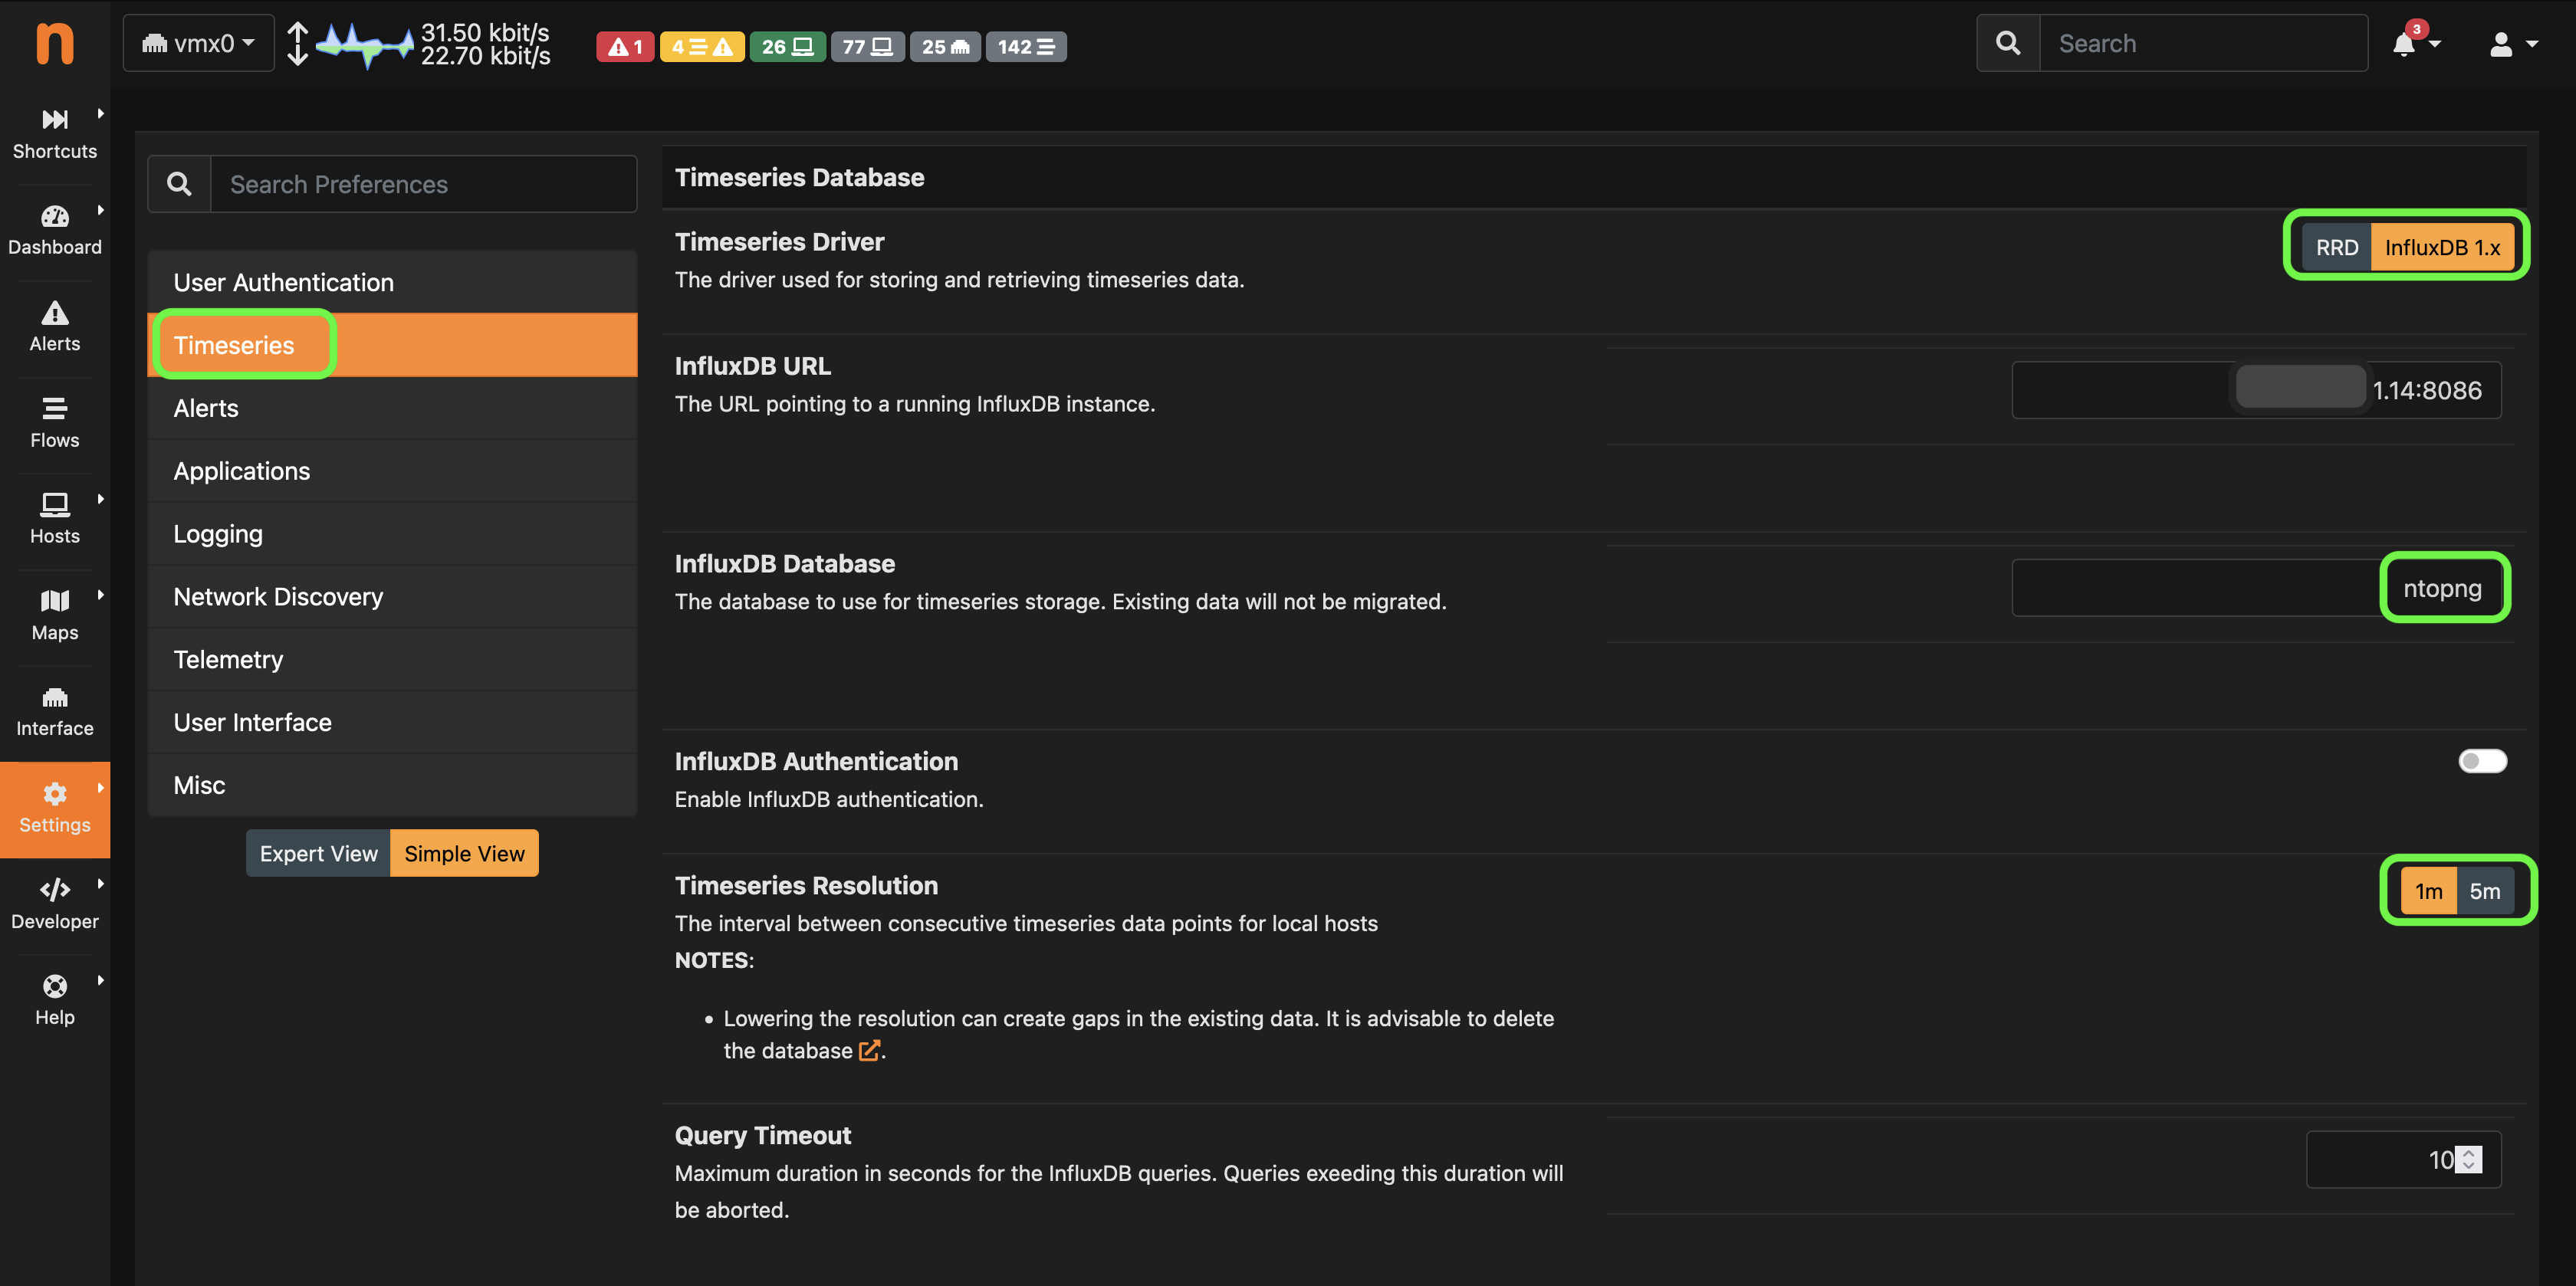
Go to Settings->Preferences
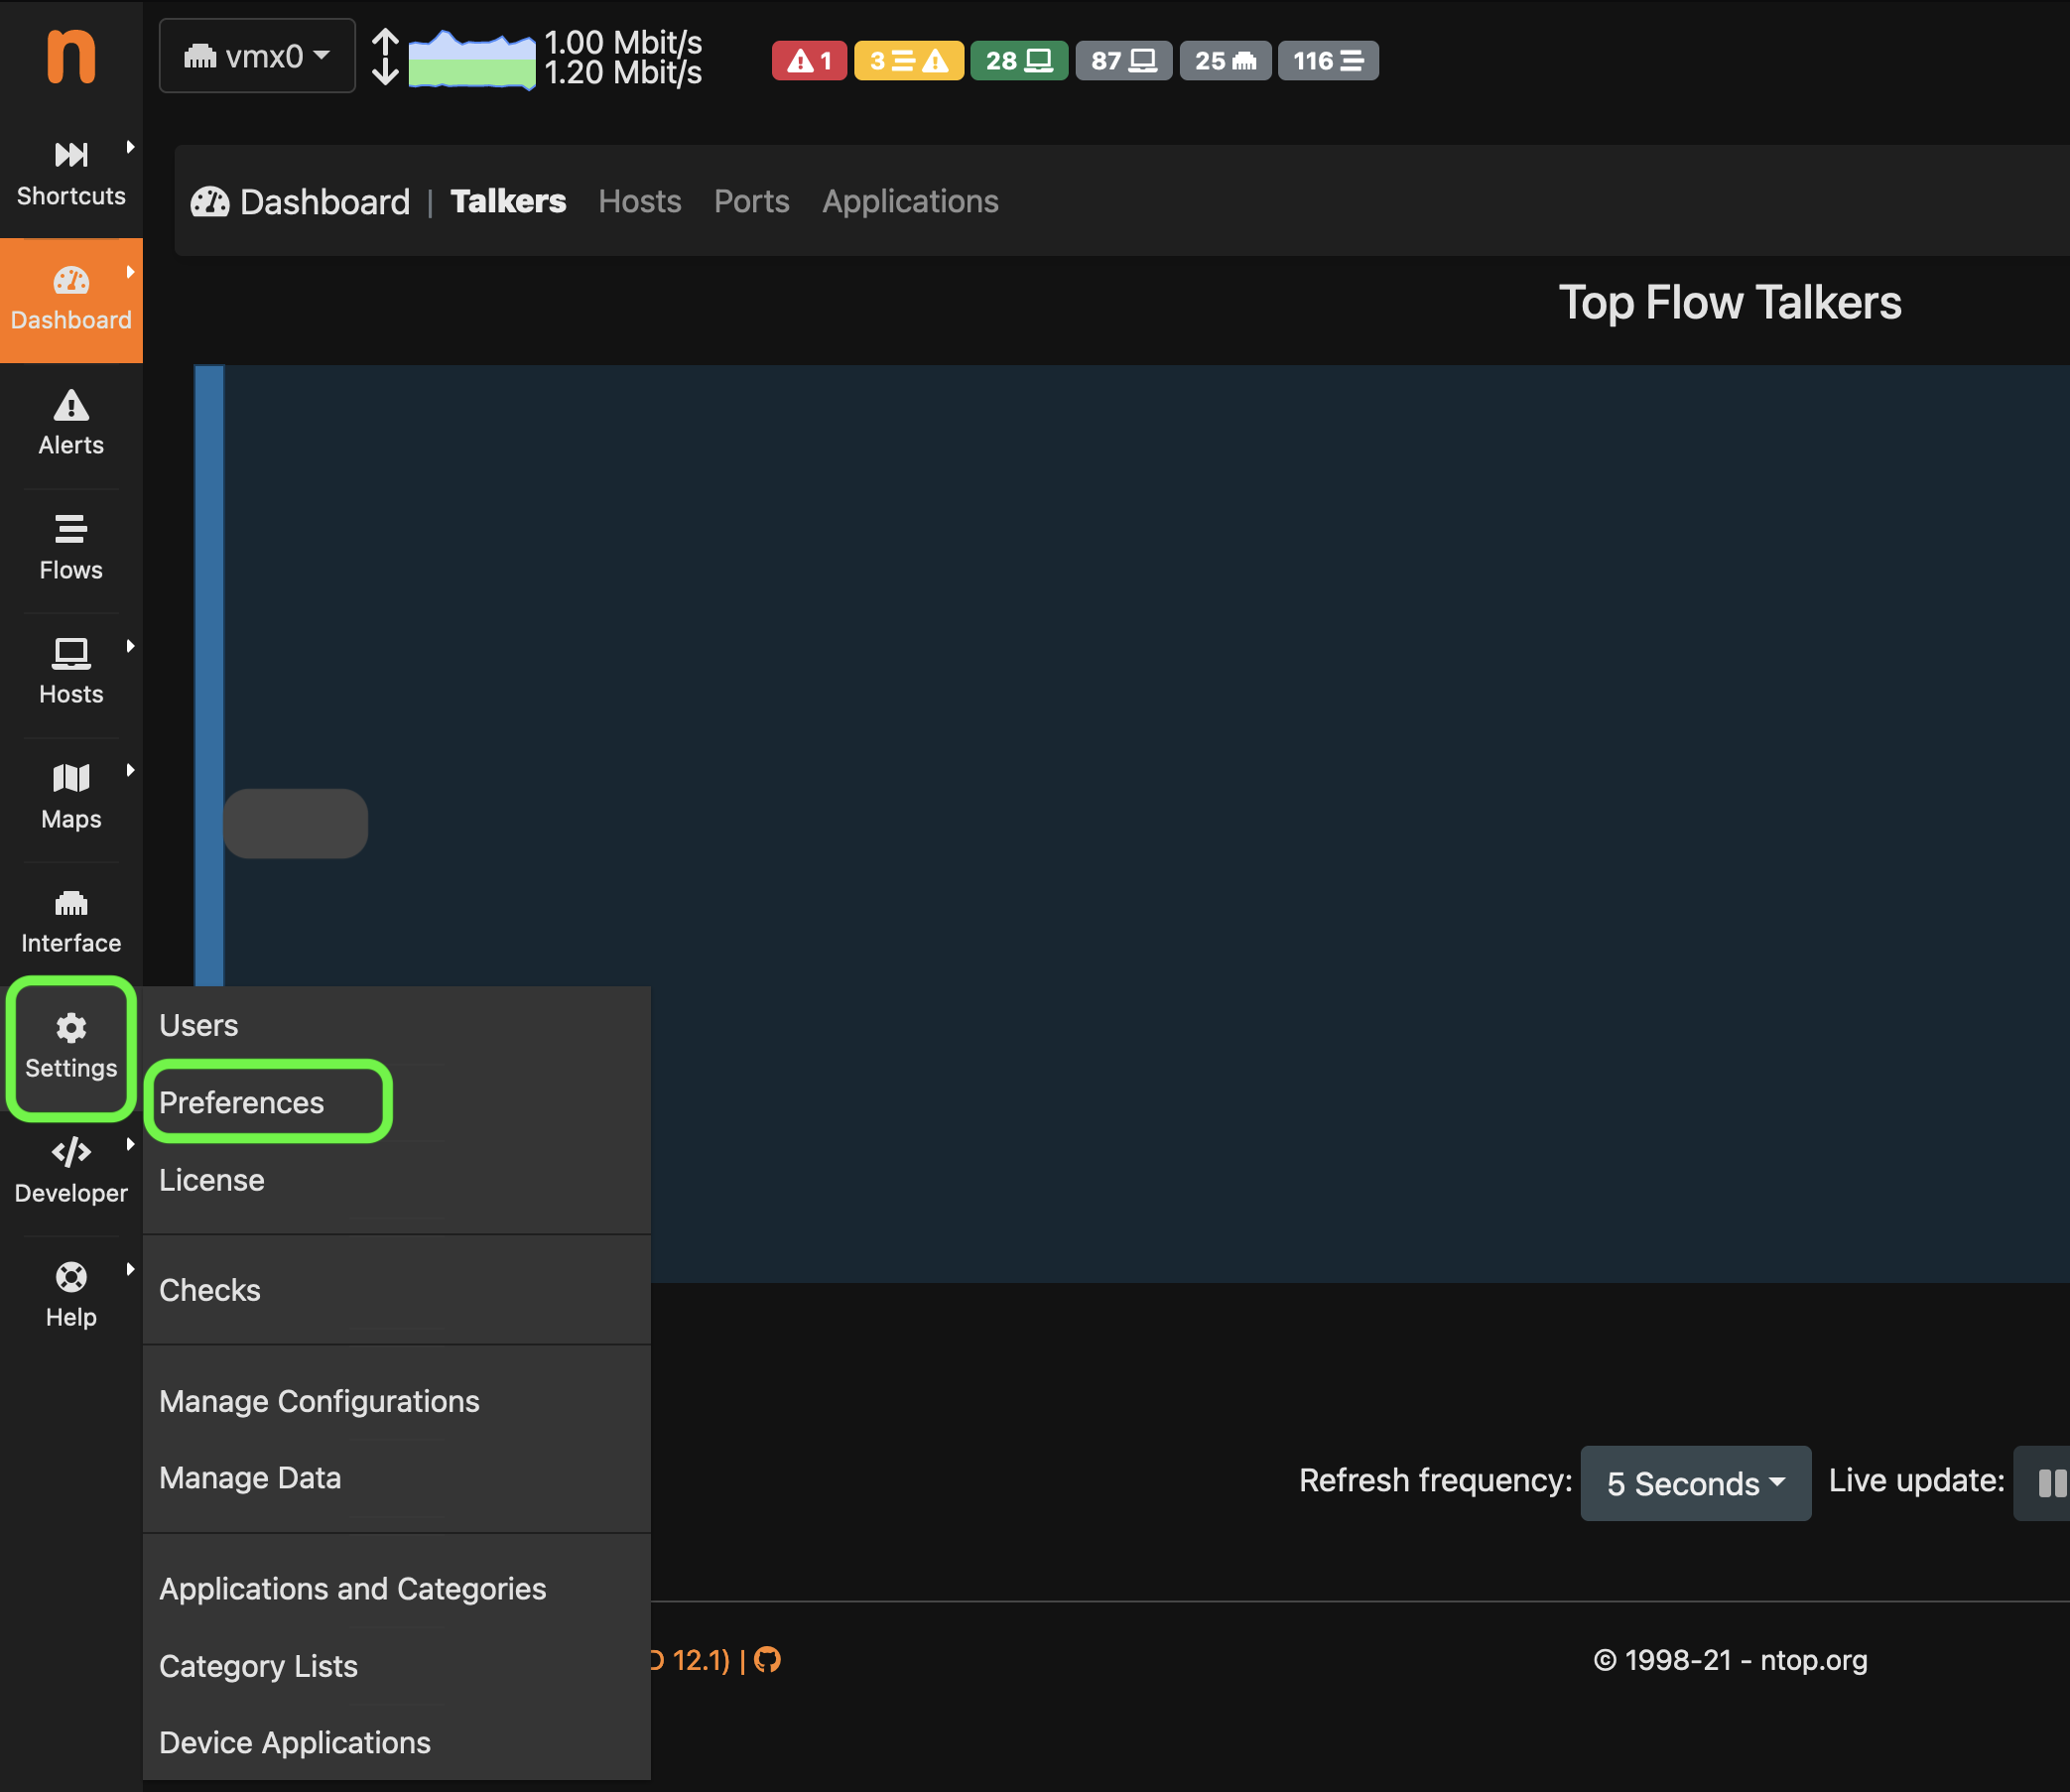
Configure ntopng to write to influxdb. The database will be automatically created.
Grafana

- Install Grafana
Official installation documentation is here
I installed grafana on the same Debian VM where I installed Influxdb.
Install Grafana on Debian
sudo apt-get install -y apt-transport-https
sudo apt-get install -y software-properties-common wget
wget -q -O - https://packages.grafana.com/gpg.key | sudo apt-key add -

echo "deb https://packages.grafana.com/enterprise/deb stable main" | sudo tee -a /etc/apt/sources.list.d/grafana.list

sudo apt-get update
sudo apt-get install grafana-enterprise
Grafana listens on port 3000. Default username and password is admin/admin

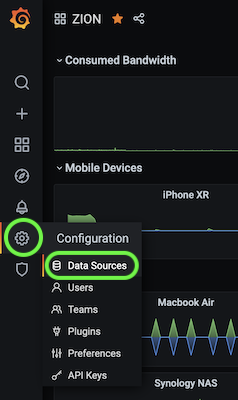
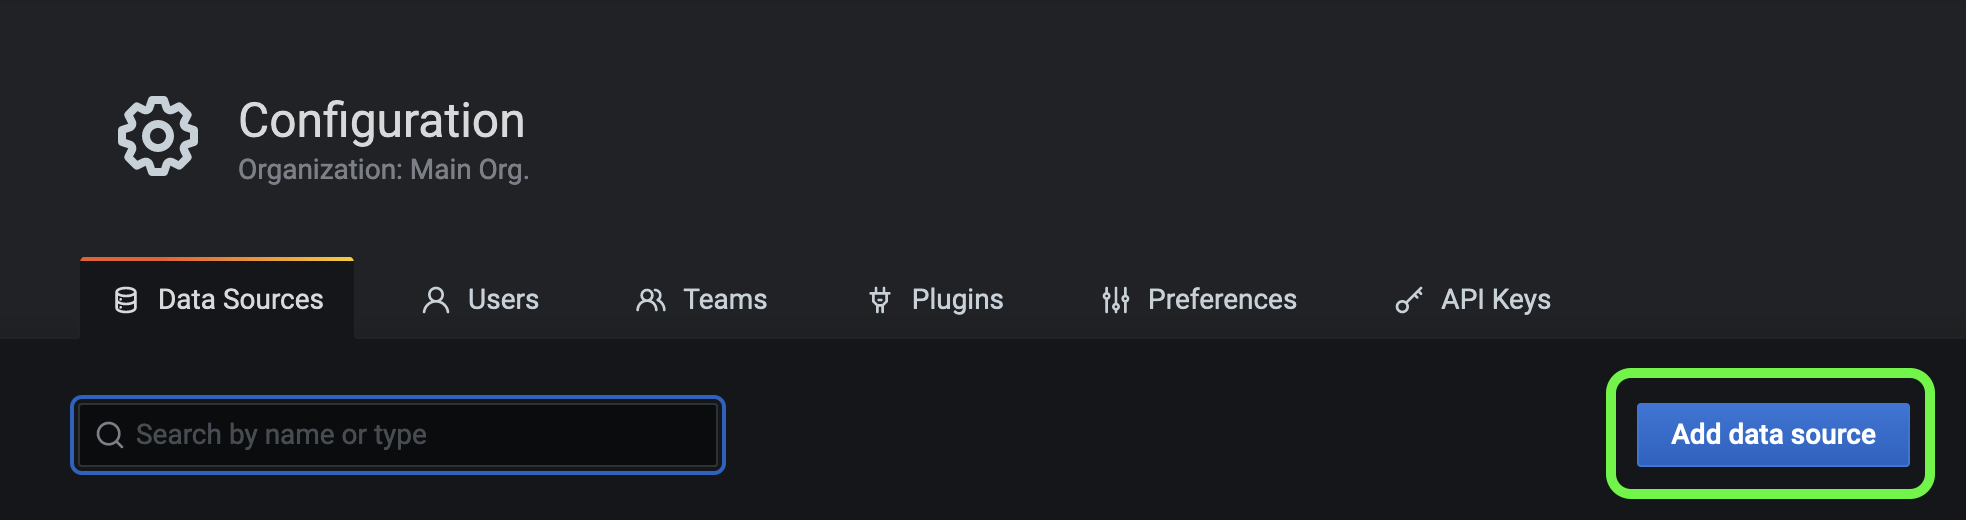
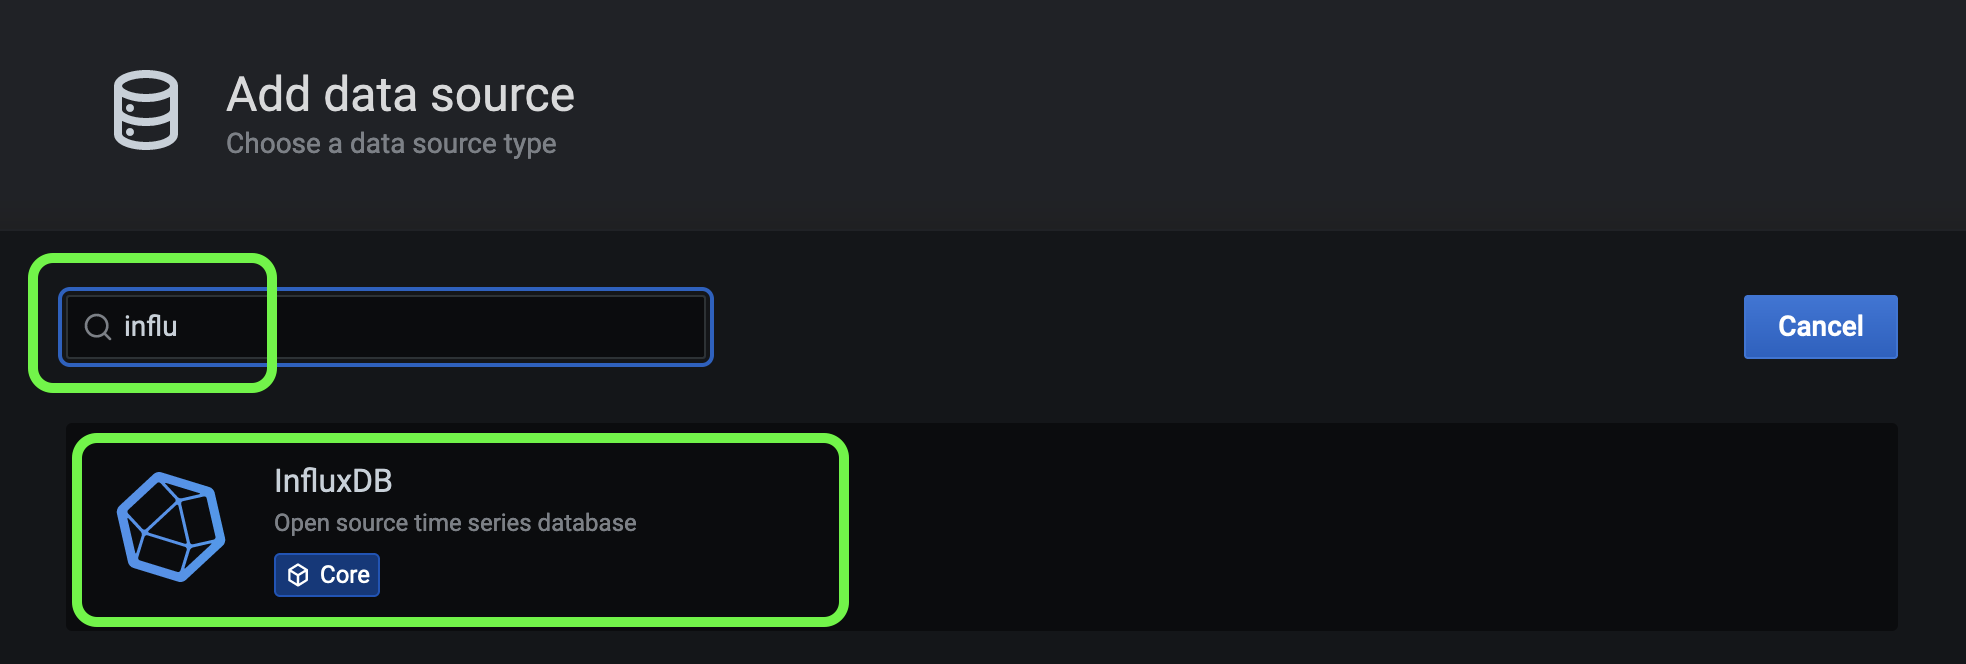
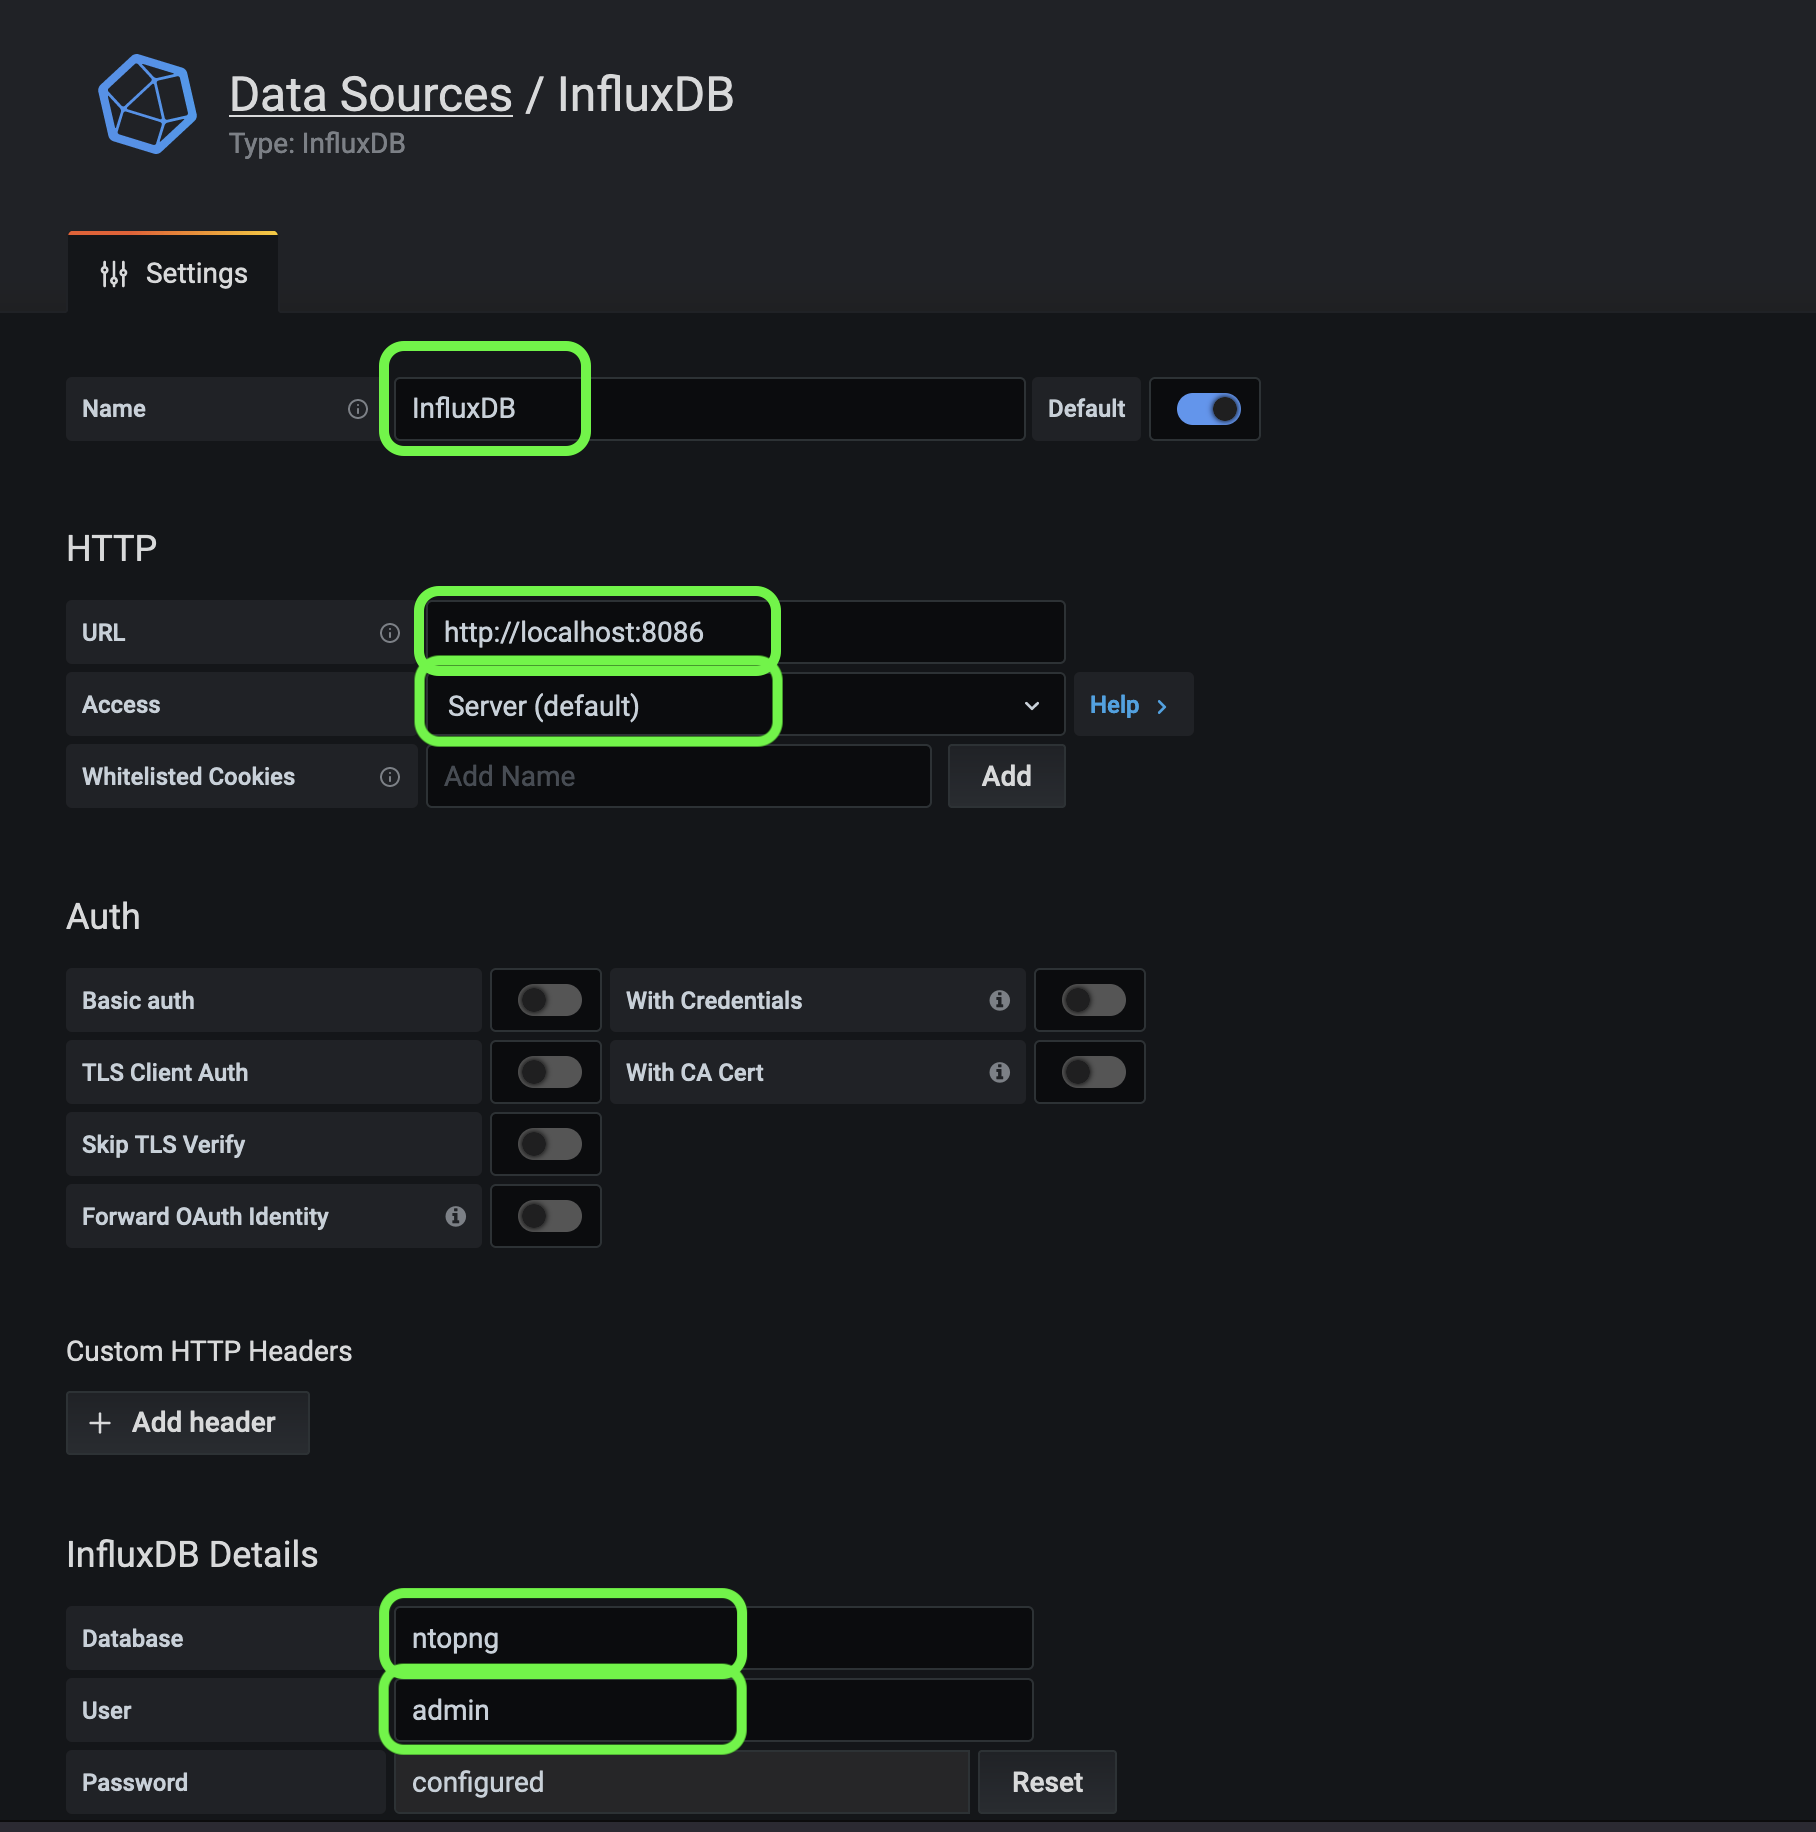
Begin by connecting to the Influx DB datasource
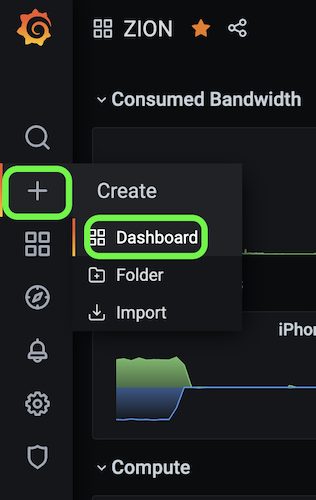
Create a new dashboard - The dashboard will contain the multiple panels you create.
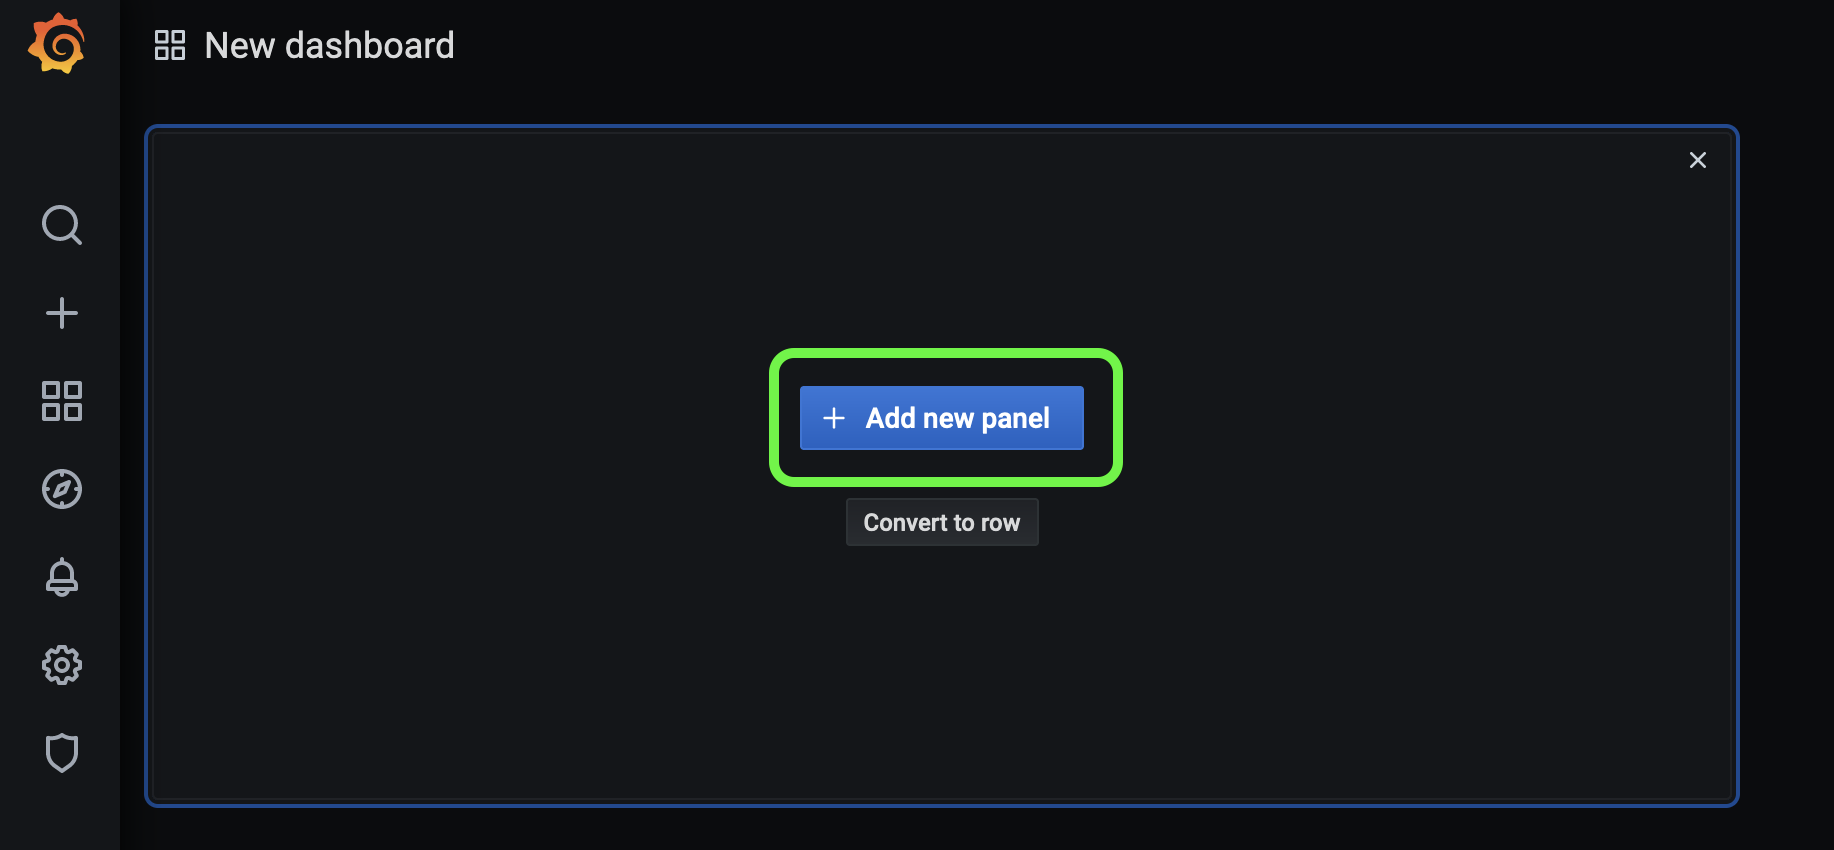
Create a new panel - The panels are used to create individual graphs.
This panel displays the download traffic on the gateway uplink.
The graph is based on bytes_sent on interface with ifid 0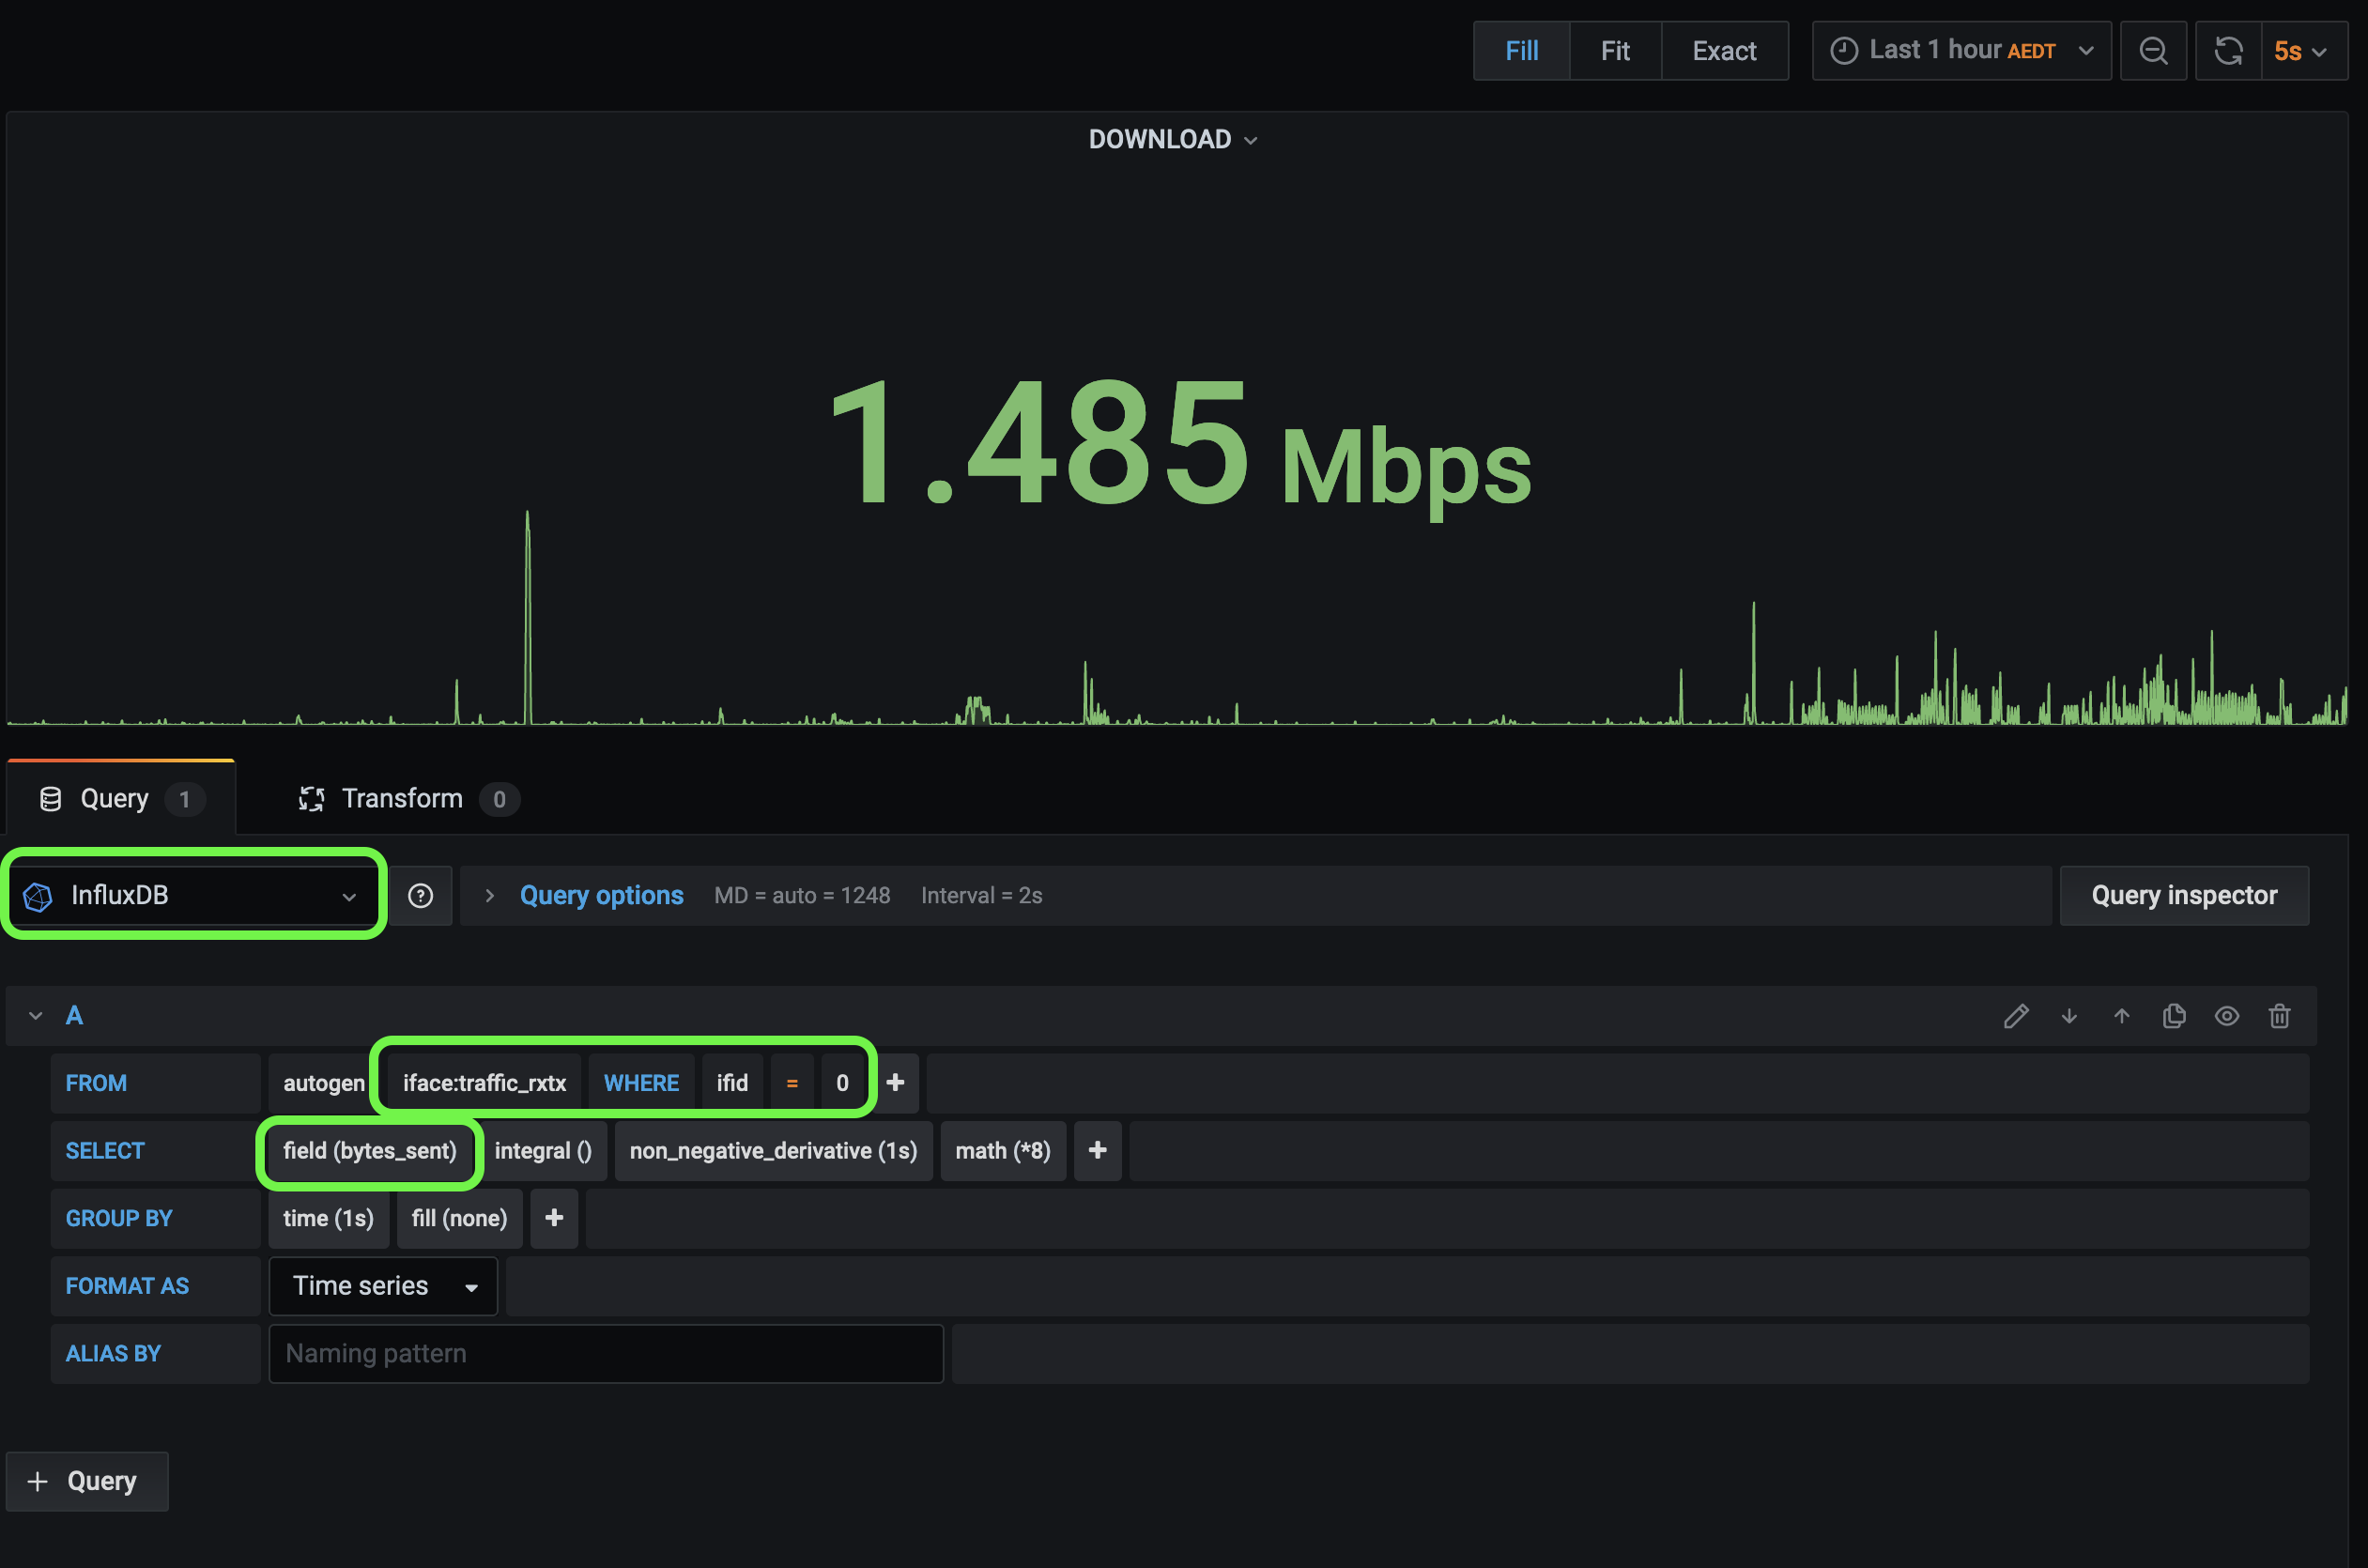
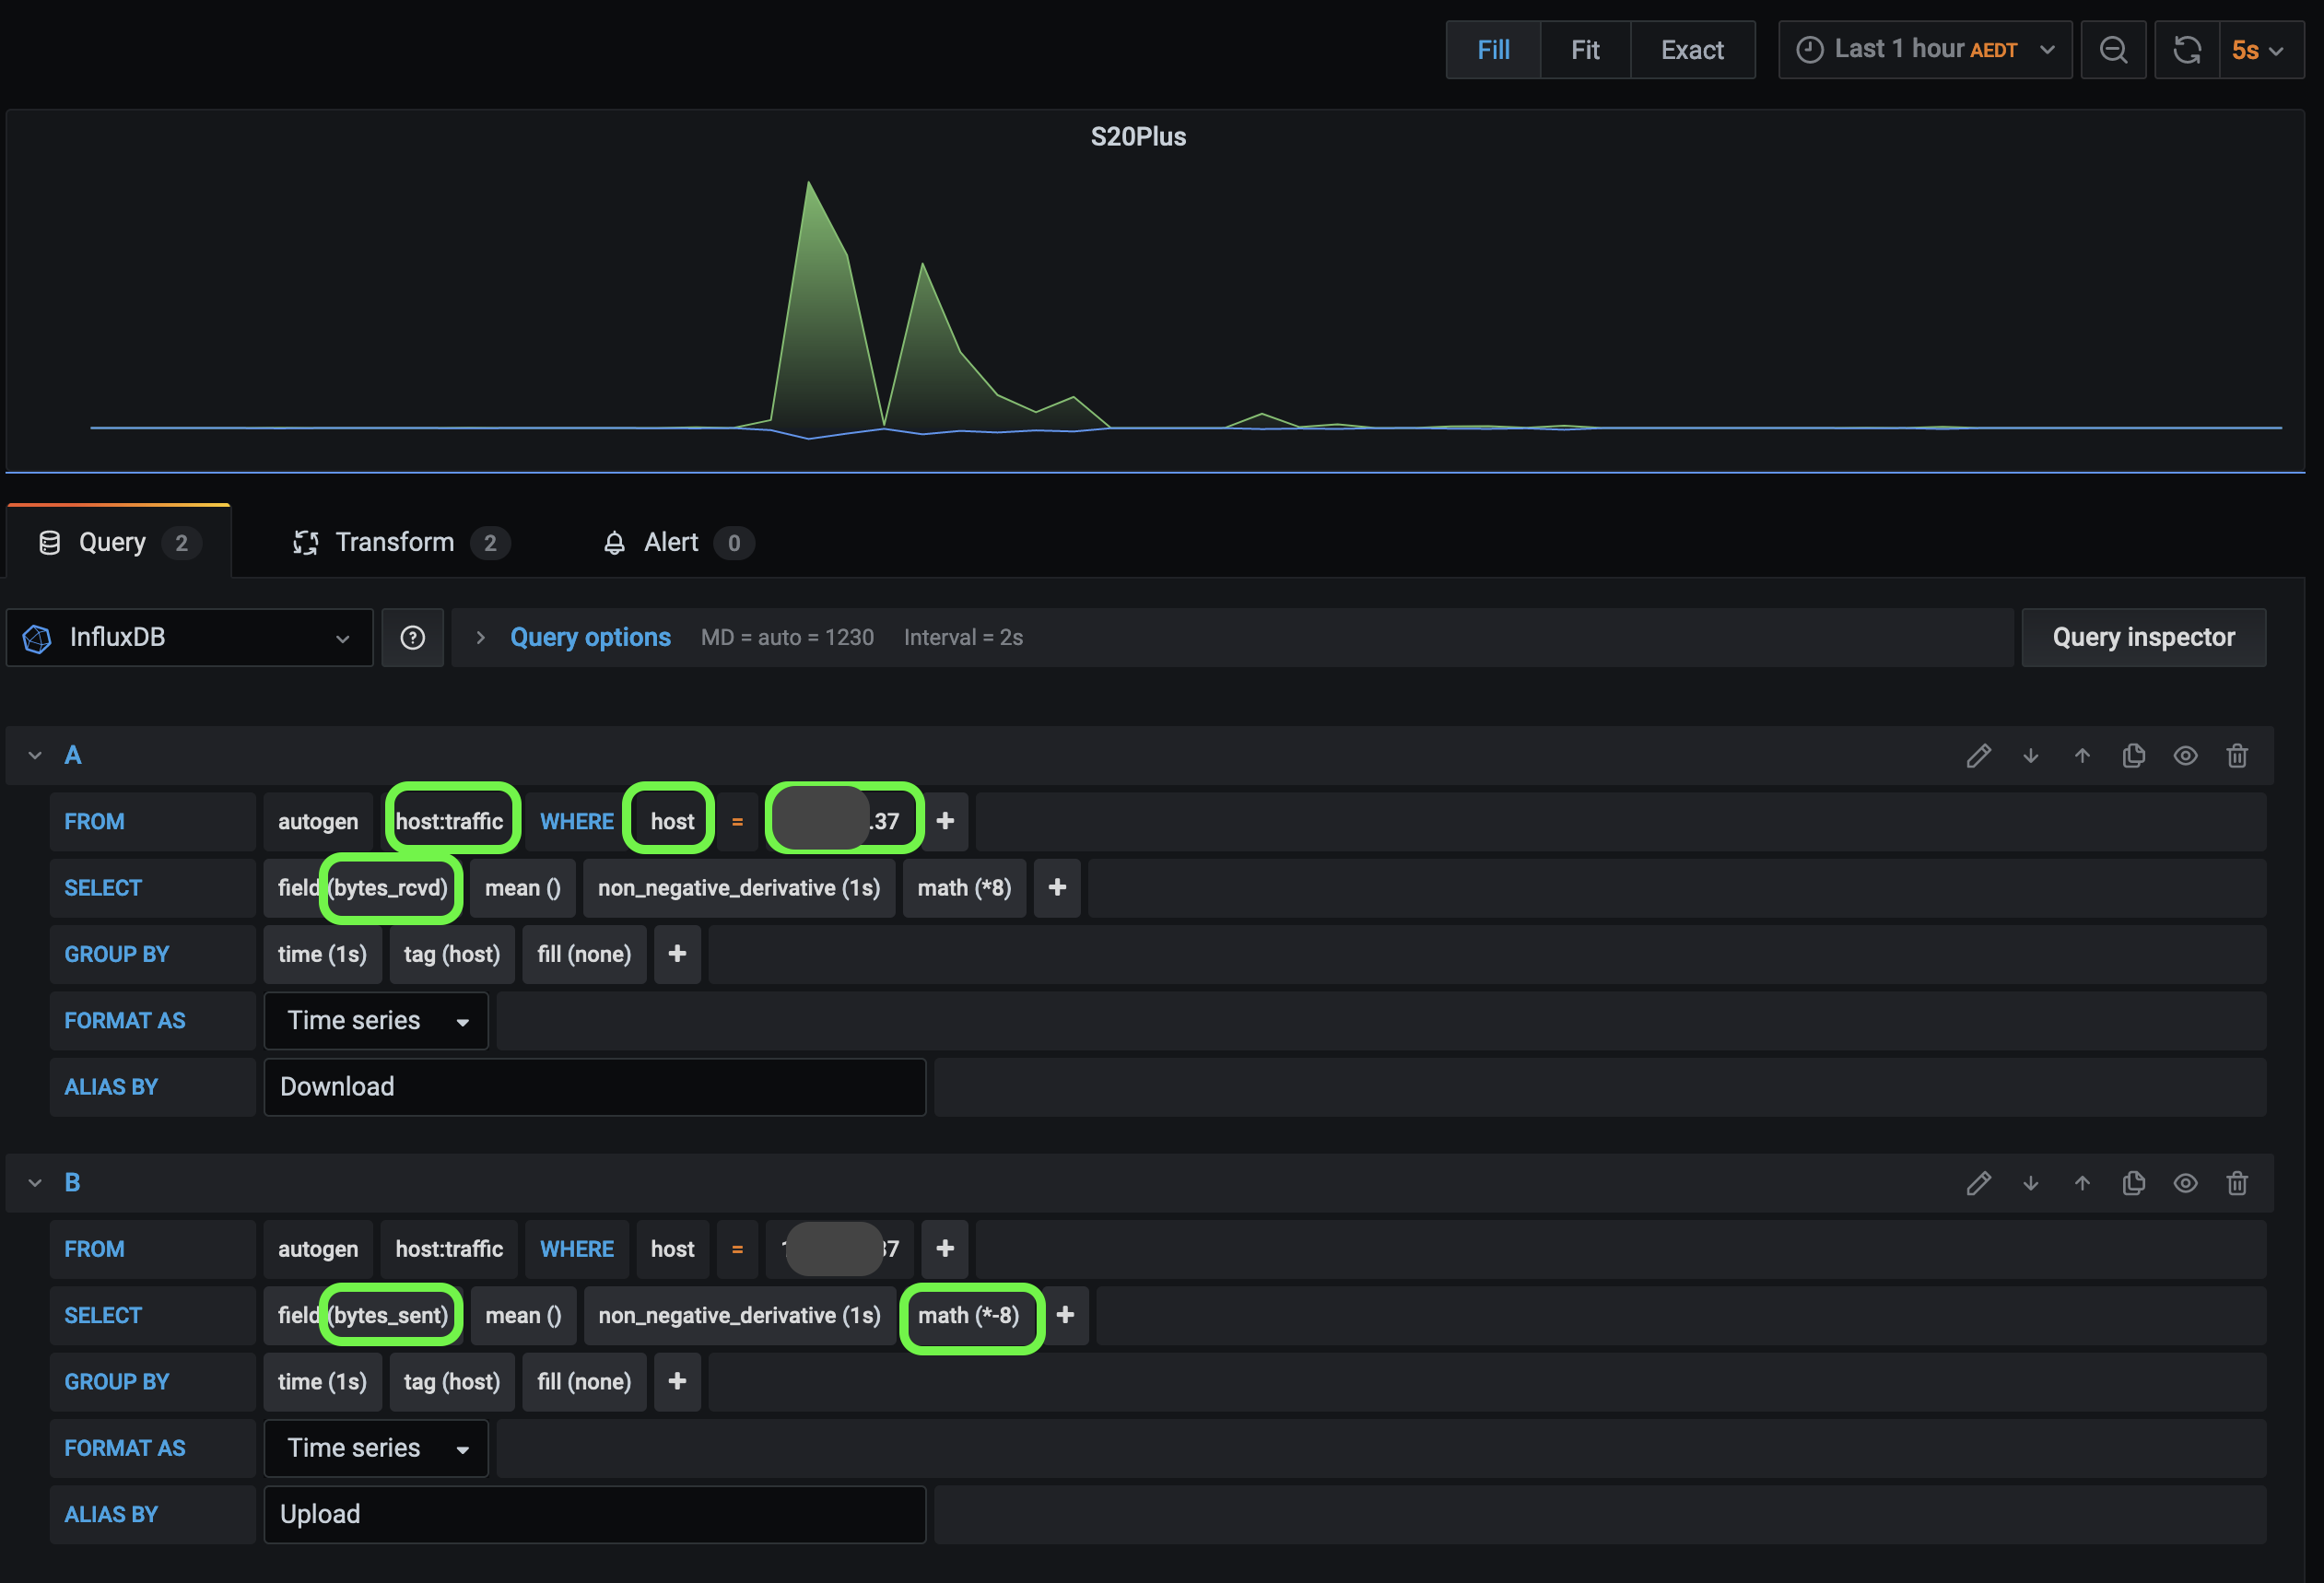
This panel displays the upload and download traffic for a specific device on your network.
The graph is based on bytes sent/received from the host table filtered by ip of the device.